World population
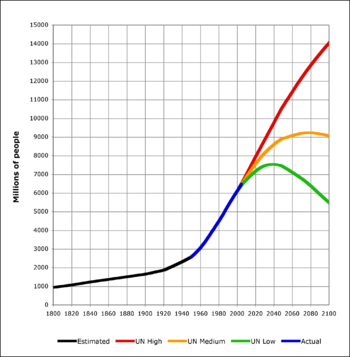
The world population is the population of humans on the planet Earth. It is currently estimated to be 6,900,500,000 by the United States Census Bureau.[1] The world population has experienced continuous growth since the end of the Black Death around the year 1400;[2] the highest rates of growth—increases above 1.8% per year—were seen briefly during the 1950s, then for a longer period during the 1960s and 1970s. The growth rate peaked at 2.2% in 1963, and declined to 1.10% by 2009. Annual births have reduced to 140 million since their peak at 173 million in the late 1990s, and are expected to remain constant, while deaths number 57 million per year and are expected to increase to 90 million per year by 2050. Current projections show a steady decline in the population growth rate, with the population expected to reach between 8 and 10.5 billion between the year 2040[3][4] and 2050.[5]
Population by region
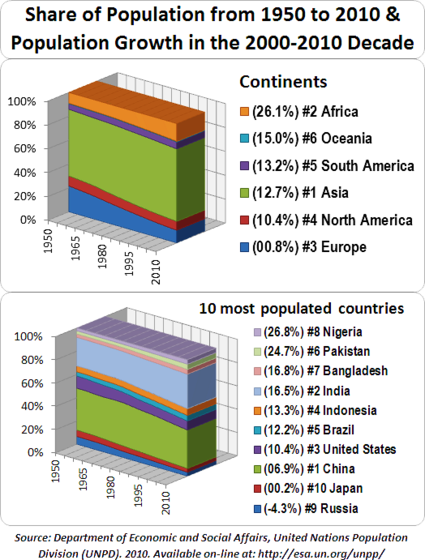
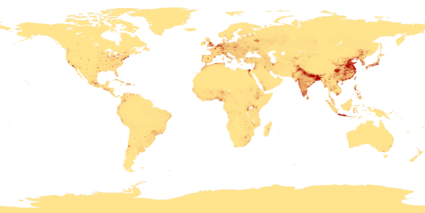
Asia accounts for over 60% of the world population with almost 3.8 billion people. China and India together have about 40 percent of the world's population. Africa follows with 1 billion people, 14% of the world's population [1]. Europe's 731 million people make up 11% of the world's population. North America is home to 514 million (8%), South America to 371 million (5.3%), and Australia to 21 million (0.3%).
Milestones by the billions
| Population (in billions) |
1 | 2 | 3 | 4 | 5 | 6 | 7 | 8 | 9 | |||||||||
|---|---|---|---|---|---|---|---|---|---|---|---|---|---|---|---|---|---|---|
| Year | 1804 | 1927 | 1960 | 1974 | 1987 | 1999 | 2011 | 2025 | 2045–2050 | |||||||||
| Years elapsed | 123 | 33 | 14 | 13 | 12 | 12 | 14 | 20-25 | ||||||||||
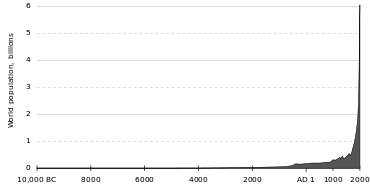
The population of the world reached one billion in 1804, two billion in 1927, three billion in 1960, four billion in 1974, five billion in 1987, and six billion in 1999. It is projected to reach seven billion by late 2011, and around eight billion by 2025. By 2045-2050, the world's population is currently projected to reach around nine billion, with alternative scenarios ranging from 7.4 billion to 10.6 billion.[6][7][8][9][10] Projected figures vary depending on such things as the underlying assumptions and which variables are manipulated in projection calculations, especially the fertility variable. Such variations give long-range predictions to 2150, ranging from population decline to 3.2 billion in the 'low scenario', to high scenarios of 24.8 billion, or soaring to 256 billion[11]
There is no estimation on the exact day or month the world's population surpassed both the one and two billion marks. The day of three and four billion were not officially celebrated, but the International Database of the United States Census Bureau places them in July 1959 and April 1974. The United Nations did determine, and celebrate, the "Day of 5 Billion" (11 July 1987), and the "Day of 6 Billion" (12 October 1999). The International Programs division of the United States Census Bureau estimated that the world reached six billion on 21 April 1999 (several months earlier than the official United Nations day). The "Day of 7 Billion" has been targeted by the United States Census Bureau to be in July 2012,[12] while the Population Division of the United Nations suggests some time in late 2011.[5]
History
Ancient and Middle Ages
A dramatic population bottleneck is theorized for the period around 70,000 BC (see Toba catastrophe theory). After this time and until the development of agriculture, it is estimated that the world population stabilized at about one million people whose subsistence entailed hunting and foraging, a lifestyle that by its nature ensured a low population density. By contrast, it is estimated that more than 55 million people lived in the combined eastern and western Roman Empire (AD 300–400).[13]
The Plague of Justinian caused Europe's population to drop by around 50% between 541 and the 8th century.[14] The population of Europe was more than 70 million in 1340.[15] The Black Death pandemic in the 14th century may have reduced the world's population from an estimated 450 million to between 350 and 375 million in 1400.[16] It took roughly 200 years for Europe's population to regain its 1340 level.[17]
At the founding of the Ming dynasty in 1368, China's population was reported to be close to 60 million, and toward the end of the dynasty in 1644 it might have approached 150 million.[18][19] England's population reached an estimated 5.6 million in 1650, up from an estimated 2.6 million in 1500.[20] New crops that had come to Asia and Europe from the Americas via the Spanish colonizers in the 16th century contributed to the population growth.[21][22] Since being introduced by Portuguese traders in the 16th century,[23] maize and manioc have replaced traditional African crops as the continent’s most important staple food crops.[24] Alfred W. Crosby speculated that increased production of maize, manioc, and other American crops "...enabled the slave traders [who] drew many, perhaps most, of their cargoes from the rain forest areas, precisely those areas where American crops enabled heavier settlement than before."[25]
The population of the Americas in 1500 may have been between 50 and 100 million.[26] Encounters between European explorers and populations in the rest of the world often introduced local epidemics of extraordinary virulence. Archaeological evidence indicates that the death of around 90% of the Native American population of the New World was caused by Old World diseases such as smallpox, measles, and influenza.[27] Over the centuries, the Europeans had developed high degrees of immunity to these diseases, while the indigenous peoples had no such immunity.[28]
Modern era
During the Agricultural and Industrial Revolutions, the life expectancy of children increased dramatically.[29] The percentage of the children born in London who died before the age of five decreased from 74.5% in 1730-1749 to 31.8% in 1810-1829.[30][31] Europe’s population doubled during the 18th century, from roughly one hundred million to almost two hundred million, and doubled again during the 19th century.[32]
The population growth became more rapid after the introduction of compulsory vaccination and improvements in medicine and sanitation.[33][34][35] As living conditions and health care improved during the 19th century, the United Kingdom's population doubled every fifty years.[36] By 1801 the population of England had grown to 8.3 million, and by 1901 had grown to 30.5 million.[37]
The population of the Indian subcontinent, which stood at about 125 million in 1750, had reached 389 million by 1941.[38] Today, the region is home to 1.5 billion people.[39] The total number of inhabitants of Java increased from about five million in 1815 to more than 130 million in the early 21st century.[40] Mexico's population has grown from 13.6 million in 1900 to about 112 million in 2009.[41] In eighty years, Kenya's population has grown from 2.9 million to thirty-seven million.[42]
Largest populations by country
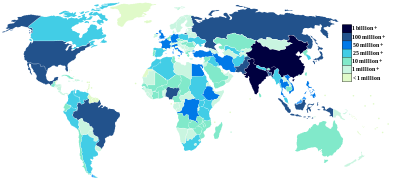
| Rank | Country / Territory | Population | Date | % of world population |
Source |
|---|---|---|---|---|---|
| 1 | 1,342,330,000 | February 14, 2011 | 19.5% | Chinese Official Population Clock | |
| 2 | 1,194,050,000 | February 14, 2011 | 17.3% | Indian Official Population Clock | |
| 3 | 311,305,000 | February 14, 2011 | 4.51% | United States Official Population Clock | |
| 4 | 238,400,000 | May 2010 | 3.39% | SuluhNusantara Indonesia Census report | |
| 5 | 194,223,000 | February 14, 2011 | 2.82% | Brazilian Official Population Clock | |
| 6 | 171,833,000 | February 14, 2011 | 2.49% | Official Pakistani Population clock | |
| 7 | 164,425,000 | 2010 | 2.38% | 2008 UN estimate for year 2010 | |
| 8 | 158,259,000 | 2010 | 2.29% | 2008 UN estimate for year 2010 | |
| 9 | 141,927,297 | January 1, 2010 | 2.06% | Federal State Statistics Service of Russia | |
| 10 | 127,380,000 | June 1, 2010 | 1.85% | Official Japan Statistics Bureau | |
| 11 | 108,396,211 | July 1, 2010 | 1.57% | INEGI estimate | |
| 12 | 94,013,200 | Mid-2010 | 1.36% | ||
| 13 | 85,789,573 | April 1, 2009 | 1.24% | Preliminary 2009 census result | |
| 14 | 81,802,257 | January 1, 2010 | 1.19% | Eurostat estimate | |
| 15 | 79,221,000 | July 2008 | 1.15% | ||
| 16 | 79,665,000 | February 14, 2011 | 1.15% | Official Egyptian Population clock | |
| 17 | 75,078,000 | 2010 | 1.09% | 2008 UN estimate for year 2010 | |
| 18 | 72,561,312 | December 31, 2009 | 1.05% | Turkish Statistical Institute estimate | |
| 19 | 67,827,000 | 2010 | 0.98% | 2008 UN estimate for year 2010 | |
| 20 | 65,447,374 | January 1, 2010 | 0.95% | Official INSEE estimate |
Approximately 4.83 billion people live in these twenty countries, representing 70.5% of the world's population as of August 2010.
Densest populations by country
| Rank | Country/Region | Population | Area (km2) | Density (Pop per km2) | Notes |
|---|---|---|---|---|---|
| 1 | 32,719 | 1.95 | 16,779 | [46] | |
| 2 | 4,620,657 | 707.1 | 6,535 | ||
| 3 | 824 | 0.44 | 1,873 | [47] | |
| 4 | 385,375 | 298 | 1,293 | ||
| 5 | 404,032 | 316 | 1,279 | ||
| 6 | 723,967 | 665 | 1,089 | [48] | |
| 7 | 157,813,124 | 147,570 | 1,069 | [49] | |
| 8 | 4,223,760 | 6,020 | 702 | ||
| 9 | 13,918 | 21 | 663 | ||
| 10 | 22,955,395 | 36,190 | 634 | [47] |
| Rank | Country | Population | Area (km2) | Density (Pop. per km2) | Notes |
|---|---|---|---|---|---|
| 1 | 1,194,050,000 | 3,287,240 | 363 | Growing country | |
| 2 | 157,813,124 | 143,998 | 1,069 | Fast growing country | |
| 3 | 127,170,110 | 377,873 | 337 | Declining in population | |
| 4 | 93,843,460 | 300,076 | 313 | Fast growing country | |
| 5 | 85,789,573 | 331,689 | 259 | Growing country | |
| 6 | 62,041,708 | 243,610 | 255 | Steady in population | |
| 7 | 49,354,980 | 99,538 | 493 | Steady in population | |
| 8 | 22,955,395 | 35,980 | 639 | Steady in population | |
| 9 | 20,238,000 | 65,610 | 309 | Growing country | |
| 10 | 16,650,000 | 41,526 | 401 | Steady in population |
Growth
.svg.png)
Different regions have different rates of population growth. According to the above table, the growth in population of the different regions from 2000 to 2005 was:
- 237.771 million in Asia
- 92.293 million in Africa
- 38.052 million in Latin America
- 16.241 million in Northern America
- 3.264 million in Europe
- 1.955 million in Oceania
- 383.047 million in the whole world
In the 20th century, the world saw the biggest increase in its population in human history due to lessening of the mortality rate in many countries due to medical advances and massive increase in agricultural productivity attributed to the Green Revolution.[50][51][52]
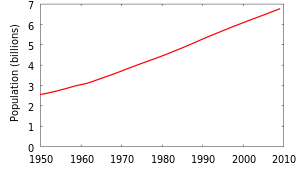
In 2000, the United Nations estimated that the world's population was growing at the rate of 1.14% (or about seventy-five million people) per year,[53] down from a peak of eighty-eight million per year in 1989. In the last few centuries, the number of people living on Earth has increased many times over. By 2000, there were ten times as many people on Earth as there were three hundred years ago. According to data from the CIA's 2005–2006 World Factbooks, the world human population increased by an average of 203,800 people every day.[54] The CIA Factbook increased this to 211,090 people every day in 2007, and again to 220,980 people every day in 2009.
| 7-8 Children 6-7 Children 5-6 Children 4-5 Children | 3-4 Children 2-3 Children 1-2 Children 0-1 Children |
Globally, the population growth rate has been steadily declining from its peak of 2.19% in 1963, but growth remains high in Latin America, the Middle East and Sub-Saharan Africa.[55]
In some countries there is negative population growth (i.e. net decrease in population over time), especially in Central and Eastern Europe (mainly due to low fertility rates). Within the next decade, Japan and some countries in Western Europe are also expected to encounter negative population growth due to sub-replacement fertility rates.
In 2006, the United Nations stated that the rate of population growth is diminishing due to the demographic transition. If this trend continues, the rate of growth may diminish to zero, concurrent with a world population plateau of 9.2 billion, in 2050.[56] However, this is only one of many estimates published by the UN. In 2009, UN projections for 2050 range from about 8 billion to 10.5 billion.[57]
 Population (est.) 10,000 BC–AD 2000. |
.png) Population (est.) 10,000 BC–AD 2000 in log y scale |
 World population 1950–2000 |
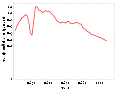 Increase rate 1950–2000 |
Forecast
| Year | UN est (millions) |
Diff. | US est (millions) |
Diff. |
|---|---|---|---|---|
| 2000 | 6,115 | - | 6,089 | - |
| 2010 | 6,909 | 794 | 6,853 | 764 |
| 2020 | 7,675 | 766 | 7,597 | 744 |
| 2030 | 8,309 | 634 | 8,259 | 662 |
| 2040 | 8,801 | 492 | 8,820 | 561 |
| 2050 | 9,150 | 349 | 9,284 | 464 |
In the long run, the future population growth of the world is difficult to predict and the UN and US Census Bureau give different estimates. According to the latter, world population will hit seven billion in July 2012[60] or by late 2011, according to UN prediction.[5]
Birth rates are declining slightly on average, but vary greatly between developed countries (where birth rates are often at or below replacement levels), developing countries, and different ethnicities. Death rates can change unexpectedly due to disease, wars and catastrophes, or advances in medicine.
The UN has issued multiple projections of future world population, based on different assumptions. Over the last ten years, the UN has consistently revised these projections downward, until the 2006 revision issued March 14, 2007 revised the 2050 mid-range estimate upwards by 273 million.
In some scenarios, disasters triggered by the growing population's demand for scarce resources will eventually lead to a sudden population crash, or even a Malthusian catastrophe (also see overpopulation and food security).
| Year | World | Asia | Africa | Europe | Latin America | Northern America | Oceania |
|---|---|---|---|---|---|---|---|
| 2000 | 6,115 | 3,698 (60.5%) | 819 (13.4%) | 727 (11.9%) | 521 (8.5%) | 319 (5.2%) | 31 (0.5%) |
| 2005 | 6,512 | 3,937 (60.5%) | 921 (14.1%) | 729 (11.2%) | 557 (8.6%) | 335 (5.1%) | 34 (0.5%) |
| 2010 | 6,909 | 4,167 (60.3%) | 1,033 (15.0%) | 733 (10.6%) | 589 (8.5%) | 352 (5.1%) | 36 (0.5%) |
| 2015 | 7,302 | 4,391 (60.1%) | 1,153 (15.8%) | 734 (10.1%) | 618 (8.5%) | 368 (5.0%) | 38 (0.5%) |
| 2020 | 7,675 | 4,596 (59.9%) | 1,276 (16.6%) | 733 (9.6%) | 646 (8.4%) | 383 (5.0%) | 40 (0.5%) |
| 2025 | 8,012 | 4,773 (59.6%) | 1,400 (17.5%) | 729 (9.1%) | 670 (8.4%) | 398 (5.0%) | 43 (0.5%) |
| 2030 | 8,309 | 4,917 (59.2%) | 1,524 (18.3%) | 723 (8.7%) | 690 (8.3%) | 410 (4.9%) | 45 (0.5%) |
| 2035 | 8,571 | 5,032 (58.7%) | 1,647 (19.2%) | 716 (8.4%) | 706 (8.2%) | 421 (4.9%) | 46 (0.5%) |
| 2040 | 8,801 | 5,125 (58.2%) | 1,770 (20.1%) | 708 (8.0%) | 718 (8.2%) | 431 (4.9%) | 48 (0.5%) |
| 2045 | 8,996 | 5,193 (57.7%) | 1,887 (21.0%) | 700 (7.8%) | 726 (8.1%) | 440 (4.9%) | 50 (0.6%) |
| 2050 | 9,150 | 5,231 (57.2%) | 1,998 (21.8%) | 691 (7.6%) | 729 (8.0%) | 448 (4.9%) | 51 (0.6%) |
Population by region
Below is a table with historical and predicted population figures shown in millions.[61][62][63][64]
The availability of historical population figures varies by region.
| Region | 1750 | 1800 | 1850 | 1900 | 1950 | 1999 | 2008 | 2050 | 2150 |
|---|---|---|---|---|---|---|---|---|---|
| World | 791 | 978 | 1,262 | 1,650 | 2,521 | 5,978 | 6,707 | 8,909 | 9,746 |
| Africa | 106 | 107 | 111 | 133 | 221 | 767 | 973 | 1,766 | 2,308 |
| Asia | 502 | 635 | 809 | 947 | 1,402 | 3,634 | 4,054 | 5,268 | 5,561 |
| Europe | 163 | 203 | 276 | 408 | 547 | 729 | 732 | 628 | 517 |
| Latin America[Note 1] | 16 | 24 | 38 | 74 | 167 | 511 | 577 | 809 | 912 |
| Northern America | 2 | 7 | 26 | 82 | 172 | 307 | 337 | 392 | 398 |
| Oceania | 2 | 2 | 2 | 6 | 13 | 30 | 34 | 46 | 51 |
| Region | 1750 | 1800 | 1850 | 1900 | 1950 | 1999 | 2008 | 2050 | 2150 |
|---|---|---|---|---|---|---|---|---|---|
| World | 100 | 100 | 100 | 100 | 100 | 100 | 100 | 100 | 100 |
| Africa | 13.4 | 10.9 | 8.8 | 8.1 | 8.8 | 12.8 | 14.5 | 19.8 | 23.7 |
| Asia | 63.5 | 64.9 | 64.1 | 57.4 | 55.6 | 60.8 | 60.4 | 59.1 | 57.1 |
| Europe | 20.6 | 20.8 | 21.9 | 24.7 | 21.7 | 12.2 | 10.9 | 7.0 | 5.3 |
| Latin America[Note 1] | 2.0 | 2.5 | 3.0 | 4.5 | 6.6 | 8.5 | 8.6 | 9.1 | 9.4 |
| Northern America | 0.3 | 0.7 | 2.1 | 5.0 | 6.8 | 5.1 | 5.0 | 4.4 | 4.1 |
| Oceania | 0.3 | 0.2 | 0.2 | 0.4 | 0.5 | 0.5 | 0.5 | 0.5 | 0.5 |
| Year | World | Africa | Asia | Europe | Latin America[Note 1] | Northern America | Oceania | Notes |
|---|---|---|---|---|---|---|---|---|
| 70,000 BC | < 0.01 | [66] | ||||||
| 10,000 BC | 1 | |||||||
| 9000 BC | 3 | |||||||
| 8000 BC | 5 | [67] | ||||||
| 7000 BC | 7 | |||||||
| 6000 BC | 10 | |||||||
| 5000 BC | 15 | |||||||
| 4000 BC | 20 | |||||||
| 3000 BC | 25 | |||||||
| 2000 BC | 35 | |||||||
| 1000 BC | 50 | [67] | ||||||
| 500 BC | 100 | [67] | ||||||
| AD 1 | 200 | [68] | ||||||
| AD 1000 | 310 | |||||||
| AD 1750 | 791 | 106 | 502 | 163 | 16 | 2 | 2 | |
| AD 1800 | 978 | 107 | 635 | 203 | 24 | 7 | 2 | |
| AD 1850 | 1,262 | 111 | 809 | 276 | 38 | 26 | 2 | |
| AD 1900 | 1,650 | 133 | 947 | 408 | 74 | 82 | 6 | |
| AD 1950 | 2,519 | 221 | 1,398 | 547 | 167 | 172 | 12.8 | |
| AD 1955 | 2,756 | 247 | 1,542 | 575 | 191 | 187 | 14.3 | |
| AD 1960 | 2,982 | 277 | 1,674 | 601 | 209 | 204 | 15.9 | |
| AD 1965 | 3,335 | 314 | 1,899 | 634 | 250 | 219 | 17.6 | |
| AD 1970 | 3,692 | 357 | 2,143 | 656 | 285 | 232 | 19.4 | |
| AD 1975 | 4,068 | 408 | 2,397 | 675 | 322 | 243 | 21.5 | |
| AD 1980 | 4,435 | 470 | 2,632 | 692 | 361 | 256 | 22.8 | |
| AD 1985 | 4,831 | 542 | 2,887 | 706 | 401 | 269 | 24.7 | |
| AD 1990 | 5,263 | 622 | 3,168 | 721 | 441 | 283 | 26.7 | |
| AD 1995 | 5,674 | 707 | 3,430 | 727 | 481 | 299 | 28.9 | |
| AD 2000 | 6,070 | 796 | 3,680 | 728 | 520 | 316 | 31.0 | |
| AD 2005 | 6,454 | 888 | 3,917 | 725 | 558 | 332 | 32.9 | |
| Jul. 1, 2008 | 6,707 | 973 | 4,054 | 732 | 577 | 337 | 34.3 | [2] |
| Year | World | Africa | Asia | Europe | Latin America | Northern America | Oceania | Notes |
- ↑ 1.0 1.1 1.2 Latin America comprises Mexico, Central America, the Caribbean and South America.
The figures for North and Central America only refer to post-European contact settlers, and not native populations from before European settlement.
Mathematical approximations
Hoerner (1975) proposed a formula for population growth[70] which represented hyperbolic growth with an infinite population in 2025.
According to Kapitsa (1997),[71] the world population grew between 67,000 BC and 1965 according to the formula:
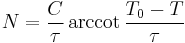
where
- N is current population
- T is the current year
- C = (1.86±0.01)·1011
- T0 = 2007±1
 = 42±1
The transition from hyperboles to slower rates of growth is related to the demographic transition.
Years for world population to double
Using linear interpolation of the UNDESA estimates, the world population has been doubled or will double in the following years (with two different starting points). Note how, during the 2nd millennium, each doubling took roughly half as long as the previous doubling, fitting the hyperbolic growth model mentioned above. However, it is unlikely that there will be another doubling in the current century.[72]
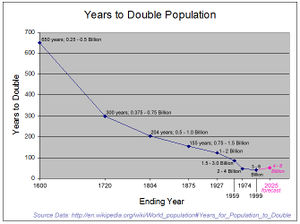
| Population (in billions) |
0.5 | 1 | 2 | 4 | 8 | |||||
|---|---|---|---|---|---|---|---|---|---|---|
| Year | 1500 | 1804 | 1927 | 1974 | 2025 | |||||
| Years elapsed | 304 | 123 | 47 | 51 | ||||||
| Population (in billions) |
0.375 | 0.75 | 1.5 | 3 | 6 | |||||
|---|---|---|---|---|---|---|---|---|---|---|
| Year | 1171 | 1715 | 1881 | 1960 | 1999 | |||||
| Years elapsed | 544 | 166 | 79 | 39 | ||||||
Demographics
Ethnicity
The world is made up of thousands of ethnic groups. The single largest ethnic group on the planet by far is Han Chinese, which represents 19.73% of the global population.
Youth
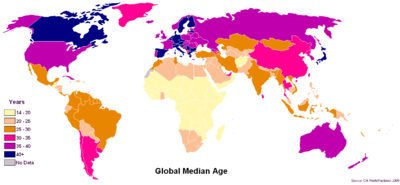
According to the 2006 CIA World Factbook, around 27% of the world's population is below 15 years of age.[73]
General
Before adding mortality rates, the 1990s saw the greatest number of raw births worldwide, especially in the years after 1995, despite the fact that the birth rate was not as high as in the 1960s. In fact, because of the 163 million-per-year raw births after 1995, the time it took to reach the next billion reached its fastest pace (only twelve years), as world population reached six billion people in 1999; at the beginning of the decade, this figure was only expected to be met in 2000, at the earliest, by most demographers.
1985–1990 marked the period with the fastest yearly population change in world history. Even though the early 1960s had a greater growth rate than in the mid and late 1980s, the population change hovered around eighty-three million people in the five-year period, with an all-time record growth change of nearly eighty-eight million in 1990. The reason is that the world's population was greater in the mid- and late-1980s (around five billion) than in the early 1960s (around three billion), which meant that the growth rate in the 1980s was not the major factor in the dramatic population change.
Forecasts of scarcity
In 1798 Thomas Malthus incorrectly predicted that population growth would out-run food supply by the mid 19th century. In 1968, Paul R. Ehrlich reprised this argument in The Population Bomb, predicting famine in the 1970s and 1980s. The dire predictions of Ehrlich and other neo-Malthusians were vigorously challenged by a number of economists, notably Julian Lincoln Simon. Agricultural research already under way, such as the green revolution, led to dramatic improvements in crop yields. Food production has kept pace with population growth, but Malthusians point out the green revolution relies heavily on petroleum-based fertilizers, and that many crops have become so genetically uniform that a crop failure would be very widespread. Food prices in the early 21st century are rising sharply on a global scale, and causing serious malnutrition to spread widely.[74]
From 1950 to 1984, as the Green Revolution transformed agriculture around the world, grain production increased by over 250%.[75] The world population has grown by about four billion since the beginning of the Green Revolution and most believe that, without the Revolution, there would be greater famine and malnutrition than the UN presently documents (approximately 850 million people suffering from chronic malnutrition in 2005).[76] The energy for the Green Revolution was provided by fossil fuels in the form of fertilizers (natural gas), pesticides (oil), and hydrocarbon-fueled irrigation.[77]
The peaking of world oil production (Peak oil) may test Malthus and Ehrlich critics.[78][79] As of May 2008, the price of grain had been pushed up by increased farming for use in biofuels,[80] world oil prices at over $140 per barrel ($880/m3),[81] global population growth,[82] climate change,[83] loss of agricultural land to residential and industrial development,[84][85] and growing consumer demand in China and India.[86][87] Food riots have recently occurred in some countries across the world.[88][89][90] However, oil prices have fallen sharply since then, and they have remained below $100/barrel since September 2008. Resource demands are expected to ease as population growth declines, but it is unclear whether rising living standards in developing countries will once again create resource shortages.
Growing populations, falling energy sources and food shortages will create the "perfect storm" by 2030, the UK government chief scientist has warned. He said food reserves are at a fifty-year low but the world will require 50% more energy, food and water by 2030.[91][92] The world will have to produce 70% more food by 2050 to feed a projected extra 2.3 billion people and as incomes rise, the United Nations' Food and Agriculture Organisation (FAO) said.[93]
The observed figures for 2007 show an actual increase in absolute numbers of undernourished people in the world, 923 million in 2007 versus 832 million in 1995.[94]; the more recent FAO estimates point out to an even more dramatic increase, to 1.02 billion in 2009.[95]
Number of humans who have ever lived
Estimates of "the total number of people who have ever lived" published in the 2000s range approximately from 100 to 115 billion (1 E11).
An estimate of the total number of people who have ever lived was prepared by Carl Haub of the Population Reference Bureau in 1995 and subsequently updated in 2002; the updated figure was approximately 106 billion.[96][97] Haub characterized this figure as an estimate that required "selecting population sizes for different points from antiquity to the present and applying assumed birth rates to each period".[97] Given an estimated global population of 6.2 billion in 2002, it could be inferred that about 6% of all people who had ever existed were alive in 2002.[96]
In the 1970s it was a popular belief that 75% of all the people who had ever lived were alive in the 1970s, which would have put the total number of people who ever lived as of the 1970s as less than the number of people alive today. This view was eventually debunked.[98]
The number is difficult to estimate for the following reasons:
- The set of specific characteristics that define a human is a matter of definition, and it is open to debate which members of early Homo sapiens and earlier or related species of Homo to include. See in this regard also Sorites paradox. Even if the scientific community reached wide consensus regarding which characteristics distinguished human beings, it would be nearly impossible to pinpoint the time of their first appearance to even the nearest millennium because the fossil record is simply too sparse. However, the limited size of population in early times compared to its recent size makes this source of uncertainty of limited importance.
- Robust statistical data only exist for the last two or three centuries. Until the late 18th century, few governments had ever performed an accurate census. In many early attempts, such as Ancient Egypt and in the Persian Empire the focus was on counting merely a subset of the people for purposes of taxation or military service.[99] All claims of population sizes preceding the 18th century are estimates, and thus the margin of error for the total number of humans who have ever lived should be in the billions, or even tens of billions of people.
- A critical item for the estimation is life expectancy. Using a figure of twenty years and the population estimates above, one can compute about fifty-eight billion. Using a figure of forty yields half of that. Life expectancy varies greatly when taking into account children who died within the first year of birth, a number very difficult to estimate for earlier times. Haub states that "life expectancy at birth probably averaged only about ten years for most of human history"[97] His estimates for infant mortality suggest that around 40% of those who have ever lived did not survive beyond one year.
United Nations and world population
Entities with competencies about population in the United Nations :
- Commission on Population and Development
- United Nations Population Division
- United Nations Population Fund
See also
|
|
Historical:
- Historical demography
- Classical demography
- Medieval demography
- The Day of Six Billion
Lists:
- List of religious populations
- List of countries by past and future population
- List of countries by population
- List of countries by population density
- List of countries by population growth rate
- List of countries by fertility rate
Further resources
- There is a map that is rescaled in order to display every country according to its population size. It is available at the University of Sheffield Worldmapper.[100]
- Population patterns and trends can be explored on the GeoHive interactive world atlas.[101]
References
- ↑ "U.S. Census Bureau - World POPClock Projection". http://www.census.gov/ipc/www/popclockworld.html.
- ↑ World population estimates
- ↑ "World Population Clock — Worldometers". Worldometers.info. http://www.worldometers.info/population/. Retrieved 2010-08-01.
- ↑ "International Data Base (IDB) — World Population". Census.gov. 2010-06-28. http://www.census.gov/ipc/www/idb/worldpopinfo.php. Retrieved 2010-08-01.
- ↑ 5.0 5.1 5.2 "World Population Prospects:The 2008 Revision". Population Division of the Department of Economic and Social Affairs of the United Nations Secretariat. June 2009. http://www.un.org/esa/population/publications/popnews/Newsltr_87.pdf.
- ↑ "Ch. 5: Population Size and Composition". World Population Prospects, the 2000 Revision. Vol.III. United Nations Population Division. p. 171. http://www.un.org/esa/population/publications/wpp2000/chapter5.pdf. Retrieved 3 July 2010
- ↑ "Executive Summary". World Population Prospects: The 2002 Revision Volume III: Analytical Report. 2002. http://www.un.org/esa/population/publications/wpp2002/English.pdf. Retrieved 3 July 2010
- ↑ World Population to 2300. New York: United Nations Department of Economic and Social Affairs: Population Division. 2004. pp. 3, 14. http://www.un.org/esa/population/publications/longrange2/WorldPop2300final.pdf. Retrieved 3 July 2010
- ↑ World Population: 1950-2050. U.S. Census Bureau, Population Division. Update as at June 2010. http://www.census.gov/ipc/www/idb/worldpopgraph.php. Retrieved 3 July 2010
- ↑ 2009 World Population Data Sheet. Washington, DC: Population Reference Bureau. 2009. http://www.prb.org/pdf09/09wpds_eng.pdf. Retrieved 3 July 2010
- ↑ "Key Findings". Long-Range Population Projections. New York: United Nations: Department of Economic and Social Affairs. 2003. http://www.un.org/esa/population/publications/longrange/longrangeKeyFind.pdf. Retrieved 3 July 2010
- ↑ "World Pop Clock Note". http://www.census.gov/ipc/www/popwnote.html.
- ↑ "Population estimates of the Roman Empire", Dr. Kenneth W. Harl
- ↑ "Plague, Plague Information, Black Death Facts, News, Photos – National Geographic". Science.nationalgeographic.com. http://science.nationalgeographic.com/science/health-and-human-body/human-diseases/plague-article.html. Retrieved 2008-11-03.
- ↑ "History of Europe – Demographic and agricultural growth". Encyclopædia Britannica.
- ↑ "Historical Estimates of World Population". Census.gov. http://www.census.gov/ipc/www/worldhis.html. Retrieved 2008-11-03.
- ↑ "Europe's Black Death is a history lesson in human tragedy — and economic renewal". TIME Europe. July 17, 2000, VOL. 156 NO. 3
- ↑ Ming Dynasty. Microsoft Encarta Online Encyclopedia 2009.
- ↑ "Qing China's Internal Crisis: Land Shortage, Famine, Rural Poverty". Asia for Educators, Columbia University.
- ↑ "History of Europe – Demographics". Encyclopædia Britannica.
- ↑ "China's Population: Readings and Maps". Columbia University, East Asian Curriculum Project.
- ↑ The Columbian Exchange. The University of North Carolina.
- ↑ Super-Sized Cassava Plants May Help Fight Hunger In Africa. The Ohio State University
- ↑ "Albert Schweitzer: a biography". James Brabazon (2000). Syracuse University Press. p.242. ISBN 0815606753
- ↑ "Savoring Africa in the New World by Robert L. Hall". Millersville University.
- ↑ J. N. Hays (1998). "The burdens of disease: epidemics and human response in western history.". p 72. ISBN 0813525284
- ↑ "The Story Of... Smallpox – and other Deadly Eurasian Germs". Public Broadcasting Service (PBS).
- ↑ "Stacy Goodling, "Effects of European Diseases on the Inhabitants of the New World""
- ↑ Population crises and cycles in history. A review of the book Population Crises and Population cycles by Claire Russell and W.M.S. Russell.
- ↑ Mabel C. Buer, Health, Wealth and Population in the Early Days of the Industrial Revolution, London: George Routledge & Sons, 1926, page 30 ISBN 0-415-38218-1
- ↑ BBC - History - The Foundling Hospital. Published: 2001-05-01.
- ↑ "Modernization - Population Change". Encyclopædia Britannica.
- ↑ "United States People". Microsoft Encarta Online Encyclopedia 2009.
- ↑ BBC - History - Victorian Medicine - From Fluke to Theory. Published: 2002-02-01.
- ↑ "19th-Century Medicine". Microsoft Encarta Online Encyclopedia 2009.
- ↑ A portrait of Britain in 2031. The Independent. October 24, 2007.
- ↑ "The UK population: past, present and future" (PDF). Statistics.gov.uk. http://www.statistics.gov.uk/downloads/theme_compendia/fom2005/01_FOPM_Population.pdf. Retrieved 2009-09-05.
- ↑ Reintegrating India with the World Economy. Peterson Institute for International Economics.
- ↑ Hundreds of millions in South Asia face growing water stress, UN report warns. UN News Centre. February 6, 2009.
- ↑ Java (island, Indonesia). Encyclopædia Britannica.
- ↑ "From Traitors to Heroes: 100 Years of Mexican Migration Policies". Jorge Durand, University of Guadalajara. March 2004.
- ↑ "Exploding population". The New York Times. January 7, 2008.
- ↑ Figure refers to Mainland China only. It excludes the special administrative regions and Taiwan.
- ↑ For the Conapo estimates, check under Republica Mexicana and press "Ver" for statistics.
- ↑ Includes 7 French overseas collectivities: French Polynesia (259,596 inh. in Aug. 2007), New Caledonia (245,580 inh. on July 27, 2009), Mayotte (186,452 inh. in July 2007), Saint Martin (35,925 inh. in Jan. 2007), Wallis and Futuna (13,484 inh. in Jul. 2008), Saint Barthélemy (8,450 inh. in Jan. 2007), Saint Pierre and Miquelon (6,125 inh. in Jan. 2006).
- ↑ The Monaco government uses a smaller surface area figure resulting in a population density of 18,078 per km².
- ↑ 47.0 47.1 Population density calculated using surface area and population figures from the CIA World Factbook.
- ↑ mohammed al a'ali (April 1, 2008). Population surge 'threat to economy'. gulf Daily News. http://gulf-daily-news.com/Story.asp?Article=213323&Sn=BNEW&IssueID=31012. Retrieved 2008-04-21.
- ↑ Latest figure from the World Bank Development Indicators Database is 1,090 per km².
- ↑ "The limits of a Green Revolution?". BBC News. 2007-03-29. http://news.bbc.co.uk/2/hi/in_depth/6496585.stm. Retrieved 2010-08-01.
- ↑ "The Real Green Revolution". Energybulletin.net. http://www.energybulletin.net/19525.html. Retrieved 2010-08-01.
- ↑ World Population to 2300 Economic and Social Affairs, United Nations, 2004
- ↑ "census.gov". census.gov. 2009-01-07. http://www.census.gov/ipc/www/worldpop.html. Retrieved 2010-08-01.
- ↑ "Current world population (ranked)". Xist.org. 2009-07-01. http://www.xist.org/earth/population1.aspx. Retrieved 2010-08-01.
- ↑ Ron Nielsen, The little green handbook, Picador, New York (2006) ISBN 0-312-42581-3
- ↑ "UN 2006 report highlights" (PDF). http://www.un.org/esa/population/publications/wpp2006/WPP2006_Highlights_rev.pdf. Retrieved 2010-08-01.
- ↑ "UN population estimates and projections, database query, August 2009". Esa.un.org. 2009-03-11. http://esa.un.org/unpp/. Retrieved 2010-08-01.
- ↑ "World Population Prospects - The 2008 Revision Population Database". Esa.un.org. 2009-03-11. http://esa.un.org/unpp. Retrieved 2010-08-01.
- ↑ "US Census Bureau - Total Midyear Population for the World: 1950-2050". Census.gov. 2010-06-28. http://www.census.gov/ipc/www/idb/worldpop.php. Retrieved 2010-08-01.
- ↑ "Notes on the World POPClock and World Vital Events". US Census Bureau. http://www.census.gov/ipc/www/popwnote.html.
- ↑ 61.0 61.1 World Population Prospects: The 2008 Revision Population Database
- ↑ "The World at". Un.org. 1999-10-12. http://www.un.org/esa/population/publications/sixbillion/sixbillion.htm. Retrieved 2010-08-01.
- ↑ "Population Growth over Human History". Globalchange.umich.edu. http://www.globalchange.umich.edu/globalchange2/current/lectures/human_pop/human_pop.html. Retrieved 2010-08-01.
- ↑ "Geo Hive: the population of continents, regions and countries (Jul. 1, 2008)". Xist.org. http://www.xist.org/earth/pop_region.aspx. Retrieved 2010-08-01.
- ↑ 65.0 65.1 "UN report 2004 data" (PDF). http://www.un.org/esa/population/publications/sixbillion/sixbilpart1.pdf. Retrieved 2010-08-01.
- ↑ fewer than 15,000 individuals according to the Toba catastrophe theory; see also Humans lived in tiny, separate bands for 100,000 years (breitbart.com)
- ↑ 67.0 67.1 67.2 an average of figures from different sources as listed at the US Census Bureau's Historical Estimates of World Population; see also *Kremer, Michael. 1993. "Population Growth and Technological Change: One Million B.C. to 1990," The Quarterly Journal of Economics 108(3): 681-716.
- ↑ The range of figures from different sources as listed at the US Census Bureau's Historical Estimates of World Population put the population at AD 1 between 170 million to 400 million.
- ↑ Hoerner, von S. Journal of British Interplanetary Society 28691 (1975)
- ↑ Sergei P Kapitza. The phenomenological theory of world population growth. Physics-Uspekhi 39(1) 57-71 (1996).
- ↑ Letters to Nature: Doubling of world population unlikely Nature, 19 June 1997
- ↑ Age structure of the world – 2006 CIA World Factbook
- ↑ "Assessing the global food crisis". BBC. April 22, 2008. http://news.bbc.co.uk/1/hi/in_depth/7361945.stm. Retrieved April 6, 2010.
- ↑ Kindall, Henery W & Pimentel, David (May 1994). "Constraints on the Expansion of the Global Food Supply". Ambio. 23 (3). http://dieoff.org/page36.htm.
- ↑ The limits of a Green Revolution?. BBC News. March 29, 2007.
- ↑ "Eating Fossil Fuels". Energy Bulletin. http://www.energybulletin.net/281.html.
- ↑ "Peak Oil: the threat to our food security". Soil Association. http://www.soilassociation.org/peakoil.
- ↑ "Peak Oil And Famine: Four Billion Deaths". Countercurrents. http://www.countercurrents.org/goodchild291007.htm.
- ↑ "2008: The year of global food crisis". Sunday Herald. http://www.sundayherald.com/news/heraldnews/display.var.2104849.0.2008_the_year_of_global_food_crisis.php.
- ↑ "The global grain bubble". Csmonitor.com. 2008-01-18. http://www.csmonitor.com/2008/0118/p08s01-comv.html. Retrieved 2010-08-01.
- ↑ James Randerson, science correspondent. "Food crisis will take hold before climate change, warns chief scientist". Guardian. http://www.guardian.co.uk/science/2008/mar/07/scienceofclimatechange.food. Retrieved 2010-08-01.
- ↑ John Vidal, environment editor. "Global food crisis looms as climate change and fuel shortages bite". Guardian. http://www.guardian.co.uk/environment/2007/nov/03/food.climatechange. Retrieved 2010-08-01.
- ↑ Walsoft (2008-02-22). "Experts: Global Food Shortages Could ‘Continue for Decades'". Marketoracle.co.uk. http://www.marketoracle.co.uk/Article3782.html. Retrieved 2010-08-01.
- ↑ "Has Urbanization Caused a Loss to Agricultural Land?". Moyak.com. http://www.moyak.com/papers/urbanization-agriculture.html. Retrieved 2010-08-01.
- ↑ Walt, Vivienne (2008-02-27). "The World's Growing Food-Price Crisis". Time.com. http://www.time.com/time/world/article/0,8599,1717572,00.html. Retrieved 2010-08-01.
- ↑ The cost of food: Facts and figures. BBC News. October 16, 2008.
- ↑ Jonathan Watts in Beijing. "Riots and hunger feared as demand for grain sends food costs soaring". Guardian. http://www.guardian.co.uk/world/2007/dec/04/china.business. Retrieved 2010-08-01.
- ↑ Already we have riots, hoarding, panic: the sign of things to come?
- ↑ Julian Borger, diplomatic editor. "Feed the world? We are fighting a losing battle, UN admits". Guardian. http://www.guardian.co.uk/environment/2008/feb/26/food.unitednations. Retrieved 2010-08-01.
- ↑ World faces 'perfect storm' of problems by 2030, chief scientist to warn. The Guardian. March 18, 2009.
- ↑ Global crisis 'to strike by 2030'. BBC News. March 19, 2009.
- ↑ Global food production will have to increase 70% for additional 2.3 billion people by 2050. Finfacts.com. September 24, 2009.
- ↑ Food and Agriculture Organization Economic and Social Development Department. “The State of Food Insecurity in the World, 2008 : High food prices and food security - threats and opportunities”. Food and Agriculture Organization of the United Nations, 2008, p. 2.
- ↑ “One sixth of humanity undernourished - more than ever before”. Food and Agriculture Organization of the United Nations, 2009
- ↑ 96.0 96.1 Curtin, Ciara (2007-03-01). "Fact or Fiction?: Living People Outnumber the Dead". Scientific American (Scientific American, Inc.) 297 (3): p. 126. September 2007. doi:10.1038/scientificamerican0907-126. http://www.sciam.com/article.cfm?id=fact-or-fiction-living-outnumber-dead. Retrieved 2008-08-04. Note: text of paper publication slightly different from text of on-line publication
- ↑ 97.0 97.1 97.2 Haub, Carl (November/December 2002). "How Many People Have Ever Lived on Earth?". Population Today (Population Reference Bureau) 30 (8): pp. 3–4. http://www.prb.org/pdf/PT_novdec02.pdf. Retrieved 2008-08-04.
- ↑ "Population Reference Bureau". Prb.org. 2002-12-01. http://www.prb.org/Articles/2002/HowManyPeopleHaveEverLivedonEarth.aspx. Retrieved 2010-08-01.
- ↑ Kuhrt, A. (1995) The Ancient Near East c. 3000–330BC Vol 2 Routledge, London. p. 695.
- ↑ "Worldmapper image". http://www.worldmapper.org/imagemaps/imagemap2.html.; "Worldmapper description". University of Sheffield. http://www.sasi.group.shef.ac.uk/worldmapper/display.php?selected=2.
- ↑ Global Statistics interactive atlas, GeoHive.
External links
- World Population Prospects, the 2008 Revision (United Nations Population Division).
- World population statistics presented in a treemap interface
- Year-by-Year World Population Estimates: 10,000 BC to AD 2007.
- Optimum Population Trust
- State of World Population 2007 report 27 June 2007 - United Nations Population Fund
- World Population Day United Nations: 11 July
- The Day of 6 Billion official homepage
- Trend of growth rate with total global population
- The World in Balance Transcript of two-part PBS' Nova on World Population
- BBC (1999). UN chief welcomes six billionth baby. URL accessed on March 7, 2005.
- Central Intelligence Agency (2004). CIA The World Factbook 2004. URL accessed on February 13, 2005.
- United Nations (2001). United Nations Population Information Network. URL accessed on February 13, 2005.
- United States Census Bureau (2004). Historical Estimates of World Population. URL accessed on February 13, 2005.
- PopulationData.net (2005). PopulationData.net - Information and maps about populations around the world.
- GeoHive GeoHive.com - World Statistics including population and future predictions.
- Population Reference Bureau www.prb.org - News and issues related to population.
- World maps, including maps of population from Year 1 to Year 2300
- World countries mapped by population size
- Berlin Institute for Population and Development "English". Berlin-institut.org. 2010-03-23. http://www.berlin-institut.org/index.php?id=48.
- World Population from the US Census Bureau in an interactive Excel dashboard
- Population clocks
- World Population Clock at the U.S. Census Bureau
- Population Counter
- World Population
- World Population Counter
- Live World Population
- (French) World Population Clock (2005). WorldPopClock.com - World population clock.
|
|||||||||||||||||||||||